Here is a belated post about our first joint group meeting, which is inspired by the recent blogpost of Emilia Gomez, one of our invited speakers. Before telling you about her talk, let me first give you a summary of the meeting itself. It took place at the end of October in the Hague.
It was a closed event, where we hosted 28 people from a number of locations. Among the invited, we had speakers coming from USA, Spain, France, Finland, Italy and Sweden. All in all, we had participation from 14 different countries. I am also proud to say that we had quite a balanced distribution of female/male scientists among our participants as well as presenters (11F/17M participants and 4F/5M presenters). The diversity of locality was matched by the diversity of various disciplines represented: we had information scientists, scientometricians, librarians, media scholars, digital humanists among the crowd.
Since one of the main objectives of COST is to stimulate knowledge flow between countries, as well as disciplines, I think that we can count this event quite successful just on the merits intermingling people from different places and disciplines. But of course, the success of the event was not only because it provided a nice combination of participants, but rather because of the content of the talks, and the discussions that sprung from them.
We hosted the event at the Koninklijke Bibliotheek in the Hague, in the same location as the UDC Seminar on Classification and Visualization: Interfaces to Knowledge. Some of our participants stayed later on for this conference, and continued the discussions started during the workshop. This overlap gave us also the opportunity to have speakers attending the conference to join us in the workshop and give talks. The New Media Guru Lev Manovich, and the information scientists Kathryn La Barre and Scott Weingart came from overseas to be at the workshop and the conference both.
We planned the workshop in a way to provide a space for scientists working on knowledge system organization to come in touch with specialists from the field of visualization. To that end, we had nine talks, organized around four sessions: Text Classification and Visualization, Knowledge Orders and Cultural Heritage, Science Maps, and Visualization of Music and Visual Genres.
The day opened with an introduction about the aims of KnowEscape by Andrea Scharnhorst, and the first session took off with Christophe Guéret‘s talk on linked data technologies, which was followed by Alexender Petersen‘s presentation on the evolution of language as a categorical system. Scott Weingart and Cassidy Sugimoto’s talk on the position (or opposition) of disciplines in the face of interdisciplinarity research was, topic-wise, a better fit to the third session of the day. However, the problems of interdisciplinarity (as well as the basic, simple question of what it is and how it should be defined) were close to the heart of the majority of participants, who in their daily research struggle with these problems. Thus, the talk managed to get everyone involved in a heated discussion right from the start of the day as a nice ice breaker :)
In the second session, Widad Mustafa El Hadi and Laurence Favier shifted the focus of the workshop from the research of what can be done with big data to what are the problems of big data in terms of creating/digitizing and managing collections. Kathryn La Barre‘s talk moved the session from digital collections of cultural heritage at large to a relatively specific set of data, namely to data on films and folktales, and on how using facets in classifying this type of cultural heritage data would help to maintain their intellectual content.
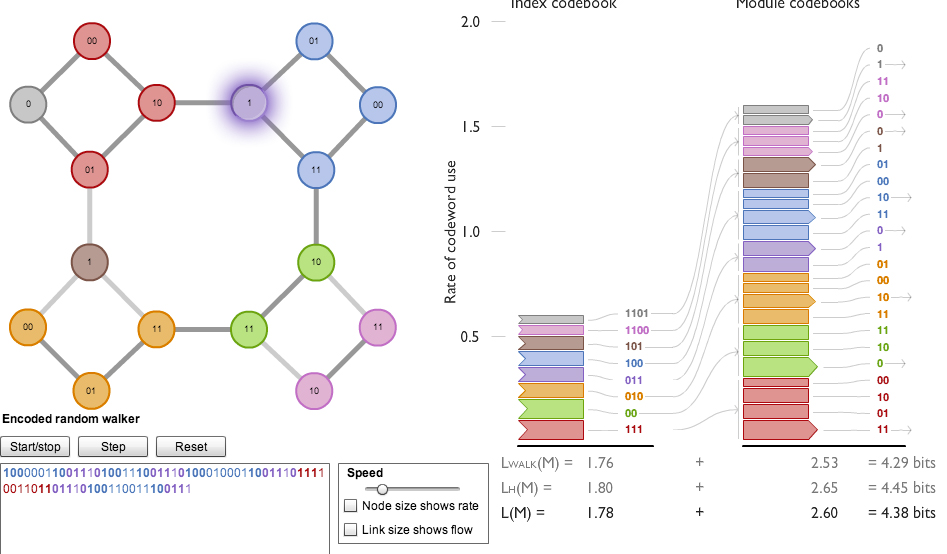
The third session of the day was on science maps, where Raj Kumar Pan showed different collaboration patterns in the physics community and how they are affected by geographical distances. Martin Rosvall‘s talk on how to visualize the flow of scientific ideas introduced a new way to analyze flow patterns: instead of describing where flow moves to depending on ‘where it is’ Rossvall suggested to describe it depending on ‘where it comes from’. A great example he gave to visualize the idea was the following: think about a network of flight routes in US. Some locations are called hubs, for example Atlanta or Las Vegas. If we do not take into account the start/end destination of people flying to Atlanta or Las Vegas, we will not be able to see the differences in these two nodes. In the case of Atlanta, if we take into account the information of ‘where it comes from,’ then we see that people will not go back to where they have come from, they fly to Atlanta in order to reach another destination. In other words, Atlanta is a hub. In contrast, people flying to Las Vegas will probably return to their original location, i.e. they will go back to ‘where they have come from’. You should check Martin’s website for details, as well as for these apps.
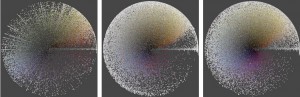
Our last session was devoted to visualization of different media: Lev Manovich, while questioning the need to categorize, gave breath-taking visualization samples of visual materials. Emilia Gomez, on the other hand, talked about the problems faced if you want to visualize music for different user groups, i.e. layman, music experts, etc. as well as to visualize different aspects of music (just to browse a collection, to see different temporal scales or to combine different musical facets such as score, rhythm, tonality or instrumentation), and for different purposes (for education, for presentation/show business, etc.). Her youtube page is full of music visualization videos that you should see!
To wrap-it up, we had a full-day where we heard and discussed diverse topics. One collaboration prospect that was born that day is the upcoming STSM visit of Almila Akdag to Alexander Petersen and Orion Penner at IMT Lucca. Please let us know if there were other upcoming project ideas in the air :)
And I leave you with two beautiful visualizations we have seen at the workshop: