STSM Report: Visualization of LOD Laundromat Data by Suzanne Tolmeijer, VU
A report on STSM-TD1210 at Indiana University, Bloomington, IN
Host: Dr. Katy Börner
Duration: April 15-24, 2016
The Knowledge Representation research group at the VU University in Amsterdam, chaired by Frank van Harmelen, has a project about the semantic web, more specifically about crawling and cleaning the Linked Open Data (LOD) available on the web to make it easy to use by everyone. During this initial visit, the goal was to get more insight into the actual content of the so-called LOD Laundromat through analyzing and visualizing the data, as well as exploring collaboration synergies between IU and the VU.
It was a busy and interesting week, with a presentation from an artist creating a sculpture about the fields of science (http://cns.iu.edu/cnstalks.html), meetings with people specialized in governance, the semantic web, data visualization and provenance, and the official opening of the Indiana University Network Science Institute. It lead to novel ideas and insights, a summary of which can be found below:
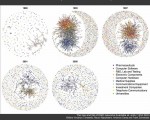
– Visualizing LOD Laundromat: there are two main ideas for visualizing the LOD gathered through the LOD Laundromat. The first one is to create a bipartite network based on vocabularies/ontologies (e.g., VIVO ontology) used and the datasets that use them. This would help identify dominant and alternative ontologies. Edges will be based on if ontologies are used in the datasets. Ontologies/Namespaces can have a threshold of being used more than once (reused). Metadata can be the number of classes, properties etc. The datasets would have a threshold of 100 or a 1000 triples, depending on the results. We can also filter based on how many entities are in the datasets, but the meaning of entities is ambiguous and should be determined first then. All metadata from the datasets can be used to be variables to determine e.g. size or color.
The second visualization is thinking about levels of abstraction to create a LOD graph of graphs (there are 600.000 datasets that could be somehow connected to one large graph). This however is a larger challenge, where more conceptual choices need to be made first.
– Issues with accessing content: the VU is specialized in crawling and cleaning the data, a challenging and important process needed for using LOD on a larger scale. However, the next step is thinking about LOD content and its usage. Because of the focus on cleaning and publishing, the means of accessing the LOD Laundromat data are not user friendly. The website only provides SPARQL options for metadata about the cleaning. There is however no metadata about the actual datasets; who provided it, or when and how often the data was used. The tool provided to query for documents with certain characteristics (‘Frank’) is written in bash and therefore not usable on Windows machines. Even after getting ‘Frank’ running, e.g., using a virtual machine, the tool is not user friendly for laymen since it is a middleware tool.
– Collaboration between VU and IU: it was an inspiring and interesting exchange of data, tools, and expertise, and IU and VU partners look forward to continue the collaboration on this and related projects.
To summarize, both challenges and opportunities for visualizations of the LOD Laundromat were established, which can further accommodate the process of visualization. Continued collaboration between IU and VU can help overcome the difficulties to get great visualizations as a result.
Suzanne Tolmeijer, VU
April 24, 2016