Expanding the use of science maps in sociological analyses by positioning actors in knowledge landscapes
STSM of Jochen Gläser (TU Berlin, Germany) at INGENIO (Valencia, Spain) 2016-03-30 to 2016-04-09
One of the enduring problems in research on the impact of governance on research content is the difficulty – if not impossibility – to draw conclusions from micro-level findings on changed conduct and content of research to macro-level changes in the dynamics of research fields. Tracing causation through the micro-level of researchers and groups is necessary because this is where governance and research content ‘meet’, and because establishing causality directly on the macro-level fails due to the many confounding variables (Gläser and Laudel 2016).
But how can one link the rich and robust findings on research trajectories of individuals and groups to macro-level changes in knowledge? This is where bibliometrics and mapping come in. Bibliometrics not only offers unobtrusive methods for addressing research content. It is also ‘scale-free’ in that it uses the same objects (publications) and their properties for analyses of research content at all levels of aggregation from the researcher to disciplines.
If sociologists could position individuals and groups on maps of knowledge, follow their intellectual trajectory and link changes in their research to the dynamics of fields, they would not only gain rich information on the intellectual world in which their subjects live but also be able to explore how individuals drive the change of fields. They could then link the micro-level responses to governance – changed research agendas – to macro-level changes of knowledge and thus complete the causal argument.
Doing this requires positioning individuals and groups in high-resolution maps of science. In order to ‘see’ individual-level changes in such a map, individual research agendas need to be linked to small clusters, i.e. the more than 100,000 clusters of the maps constructed by Boyack and Klavans (Boyack and Klavans 2014) or the 22,412 research areas of the classification system developed by Waltman and van Eck (Waltman and van Eck 2012).
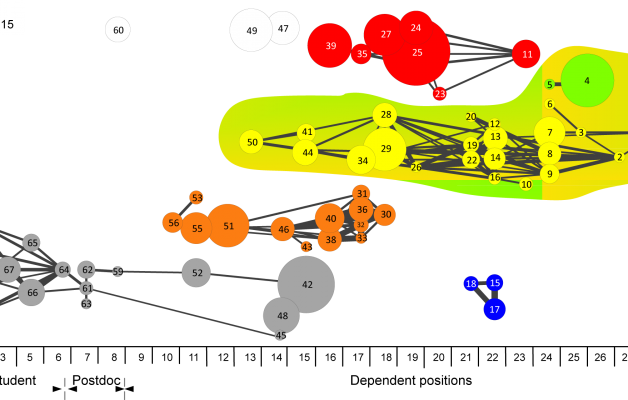
Discussing the opportunities to do this with publicly available, easy-to-use and non-proprietary methods was the purpose of my STSM at INGENIO in Valencia. In discussions with Ismael Rafols and his colleagues I explored opportunities to link micro-level bibliometric profiles of researchers to maps of science. Bibliometric representations of research trails are a standard instruments in my qualitative, interview based studies (Diagram). They are based on Web of Science publications, and their UT can be used to identify them in a publication-based map of science. How robust, accurate and informative such a positioning is, and what it tells us about the elusive micro-macro link in knowledge production, remains will be the subject of further collaborative research.
Example of representations of research trails used in interviews (based on bibliographic coupling, see Gläser and Laudel 2015 for more details).
Jochen Gläser
TU Berlin, Germany
References
Boyack, Kevin W. and Richard Klavans (2014). Creation of a highly detailed, dynamic, global model and map of science. Journal of the Association for Information Science and Technology 65(4): 670-685.
Gläser, Jochen and Grit Laudel (2015). A Bibliometric Reconstruction of Research Trails for Qualitative Investigations of Scientific Innovations. Historical Social Research – Historische Sozialforschung 40(3): 299-330.
Gläser, Jochen and Grit Laudel (2016). Governing science: how science policy shapes research content. European Journal of Sociology 57(1): forthcoming.
Waltman, Ludo and Nees Jan van Eck (2012). A new methodology for constructing a publication-level classification system of science. Journal of the American Society for Information Science and Technology 63(12): 2378-2392.


