First I would like to express my warmest thanks to Peter Mutschke, and to my visit co-ordinator Andrea Scharnhorst for their continuous support and the opportunity of this Short Term Scientific Mission (STSM) in the Netherlands in the frame of the KNOWeSCAPE COST Action.
My stay in the Netherlands during the STSM from February 15th to the 22nd, 2014 was set up after providing the host letter and the mandatory registration, which is a very simple process well described on the homepage of KNOWeSCAPE, the approval by Prof. Santo Fortunato and the clarifications of all details.
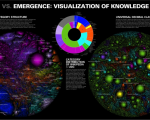
During that week I had the opportunity to discuss data analysis and visualization with knowledgeable people (Dirk Roorda, Linda Reijnhoudt, Henk van den Berg, Joke Pol, Peter Doom Albert Meroño Peñuela, Frank van der Most and others) with a lot of experience. Based on these discussions it is to be stated that there is no standardized metric process to visualize results. Usually with different correlations, absolute and relative figures results are to be visualized to find out the best way to express the relationship between parameters. Heat maps are a practicable and efficient way to show dependencies of parameters and are not standardized. Design, layout and legend could be freely selected corresponding to one´s ideas and should be very expressive. First a generic visualization solution is implemented it can be re-used for other applications assumed the data basis and structure is at least adaptable to the application flow chart. Idea exchanging could make it possible in the future to work jointly in projects and develop solutions for different tasks.
This STSM was for me very helpful and allows me based on my experience to see data analysis challenges from different perspectives and develop creative and future-proof solutions.
Cologne, Karima Haddou ou Moussa


